This week was almost a review from last semester’s data visualization class which was nice! I chose the “Wool” dataset in carData package but I ended up downloading it through read.csv(“Wool.csv”) function after putting the .csv file in my R programming folder.
I originally chose this dataset because my sister lives in New Zealand on a sheep farm (not kidding) and my mom has been knitting wool clothes for my baby nephew.
https://vincentarelbundock.github.io/Rdatasets/datasets.html
Dataset website where I chose the “Wool” dataset
I noticed trends within the data and felt it was important to understand the column headings and variables I was working with so I looked them up. Below are the variables I will be working with for my three visualizations.
Data Visualization #1: Simple Histogram
This simple histogram highlights how most wool, even if it has a higher length or thread count, will fail while washing cycles within the first 2000 cycles.
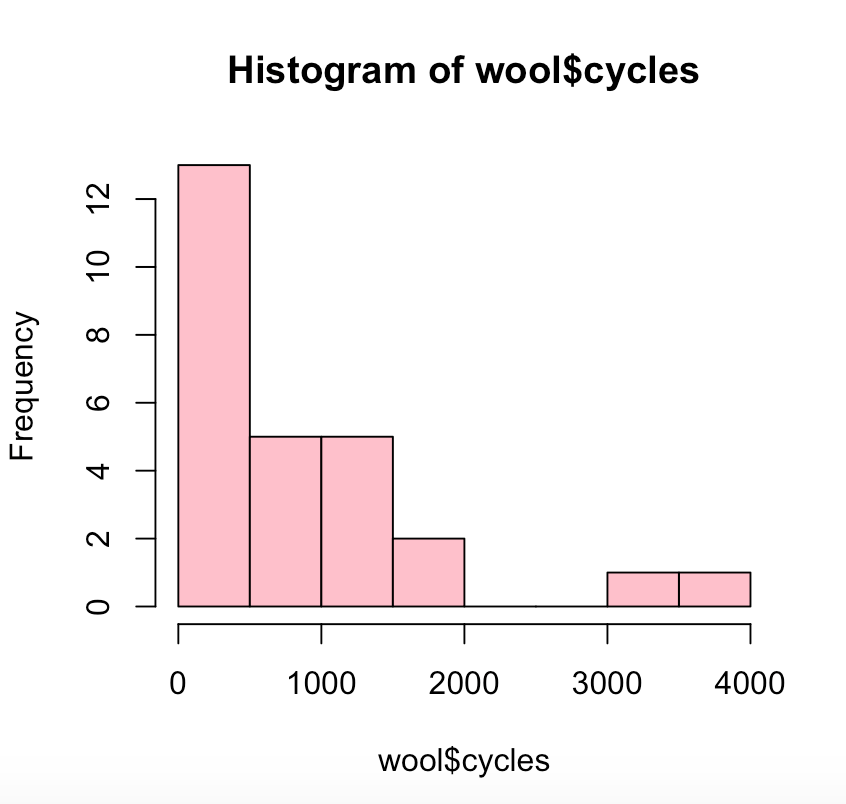
hist(wool$cycles, col=”pink”)
R Code
Data Visualization #2: Line/Point Graph
There was not a lot of linear data so I did not connect the data by a line. Instead I choice points to visualize the continuing theory that the higher length grants more cycles of washing pertaining to wool data.
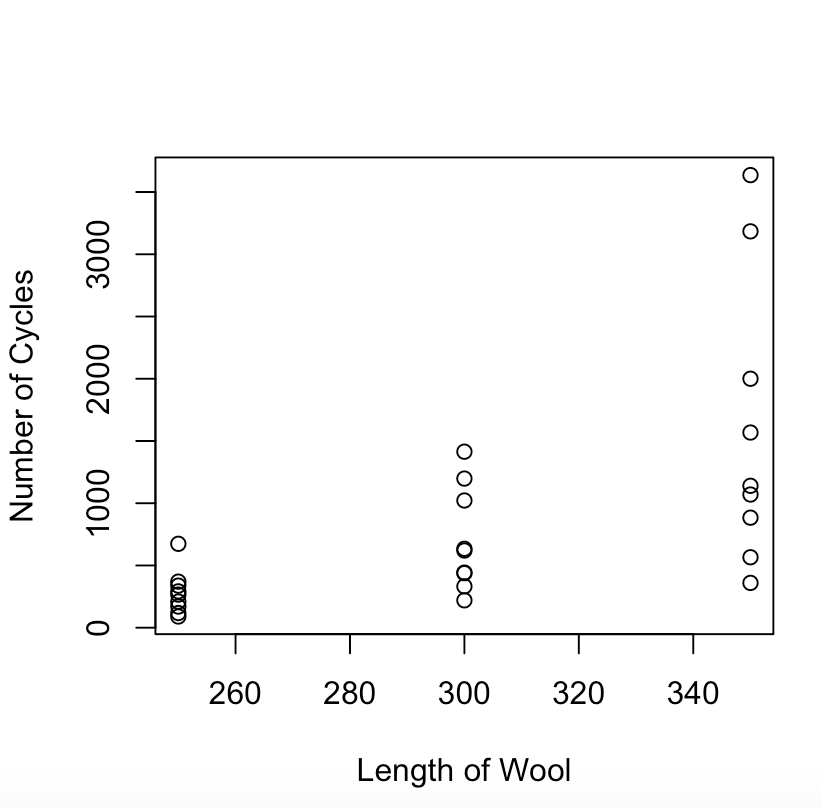
lineWool <- plot(wool$len, wool$cycles, type=”p”, xlab=”Length of Wool”, ylab=”Number of Cycles”)
R Code
I found this graph to be interesting as there is a pretty significantly varying distribution of cycles(~500 – ~4000) for the 350 length wool while the 250 length wool stayed at less than 1000 cycles.
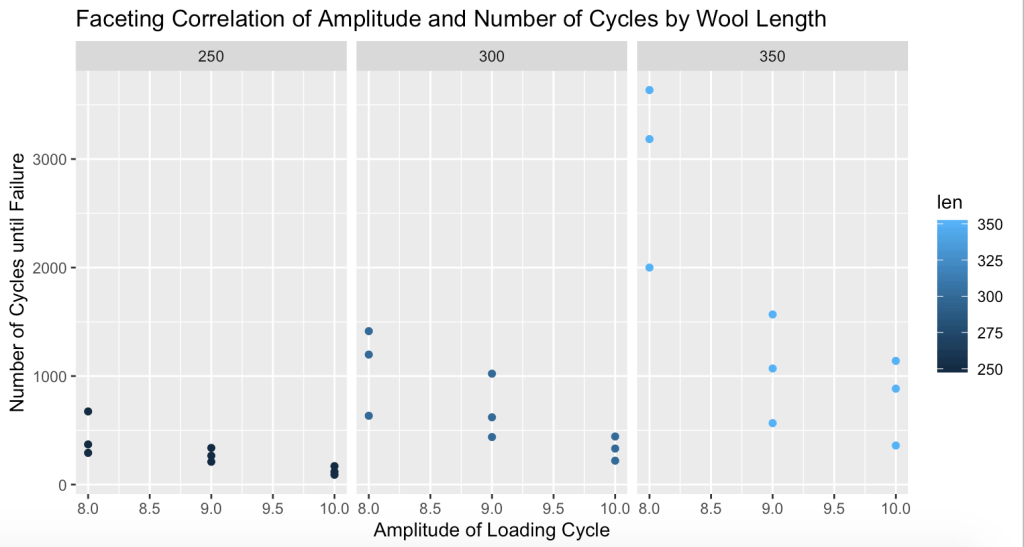
Data Visualization #3: Faceting
Faceting was my favorite type of visualization I learned last semester so I decided to include it in this module because I recognized that there were 3 distinct lengths of wool to facet and show their cycle failure patterns with.
> facet.wool <- ggplot(wool, aes(x=amp, y=cycles, col=len)) + xlab(“Amplitude of Loading Cycle”) +ylab(“Number of Cycles until Failure”) + ggtitle(“Faceting Correlation of Amplitude and Number of Cycles by Wool Length”) + geom_point()
R Code
> facet.wool + facet_grid(~wool$len)
GitHub Link: https://github.com/mslement/IntroRProgrammingSlement/blob/master/Module9Visualizations
